
LENS
Redlining's Legacy
Crime and poverty higher in Cleveland neighborhoods that faced lending restrictions decades ago
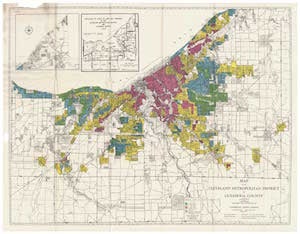 IMAGE: The Ohio State University Libraries, 2013. Federal Holc “Redlining” Maps for Ohio Cities. Accessed Aug. 3, 2018.
This 1940 map created by the federal Home Owners’ Loan Corp. divided up greater Cleveland based on desirability for lending purposes. Areas in green were the most desirable, those in blue were still desirable, neighborhoods in yellow were considered declining and those in red were deemed the most risky for lenders.
Cleveland has struggled for decades with poverty and other vexing social problems.
Now, a team of Case Western Reserve researchers is examining whether the cause can be traced to bank redlining that began in the 1930s.
By looking at historical and contemporary maps, researchers realized that neighborhoods struggling today with poverty, crime and health issues are areas where, nearly 90 years ago, banks denied housing loans to black Americans and other minorities— an action that made homebuying more difficult and discouraged investments in infrastructure, businesses and education.
"We were stunned" looking at the maps involving redlining and the locations of certain sexual assaults and elevated lead levels in children, said Misty Luminais, PhD, a senior research associate with the Begun Center for Violence Prevention Research and Education at the Jack, Joseph and Morton Mandel School of Applied Social Sciences, who is working with fellow senior researcher Rachel Lovell, PhD, on the project. "The similarities between the maps are striking, to the point that, without labels, it can be hard to determine which one is which."
The two—along with graduate student Kristen Berg—noticed the connections as they combed through data for a separate project involving previously untested sexual assault kits. They found that East Side Cleveland neighborhoods with the most significant levels of redlining, based on a map from 1940 (shown above), also reported the highest numbers of sexual assaults with untested kits in Cuyahoga County and the highest percentage of children with elevated lead levels. The neighborhoods also had poor internet access, "almost to the exact same borders," Lovell said.
"This confluence of factors is not occurring independently," Luminais said.
No doubt other factors also are contributing to the difficult circumstances in certain neighborhoods today, including poverty and neighborhood disinvestment.
But the researchers are intrigued by the potential impact of the decades-old redlining and want to examine the "snowball effect over generations" that has led to current circumstances, Lovell said.