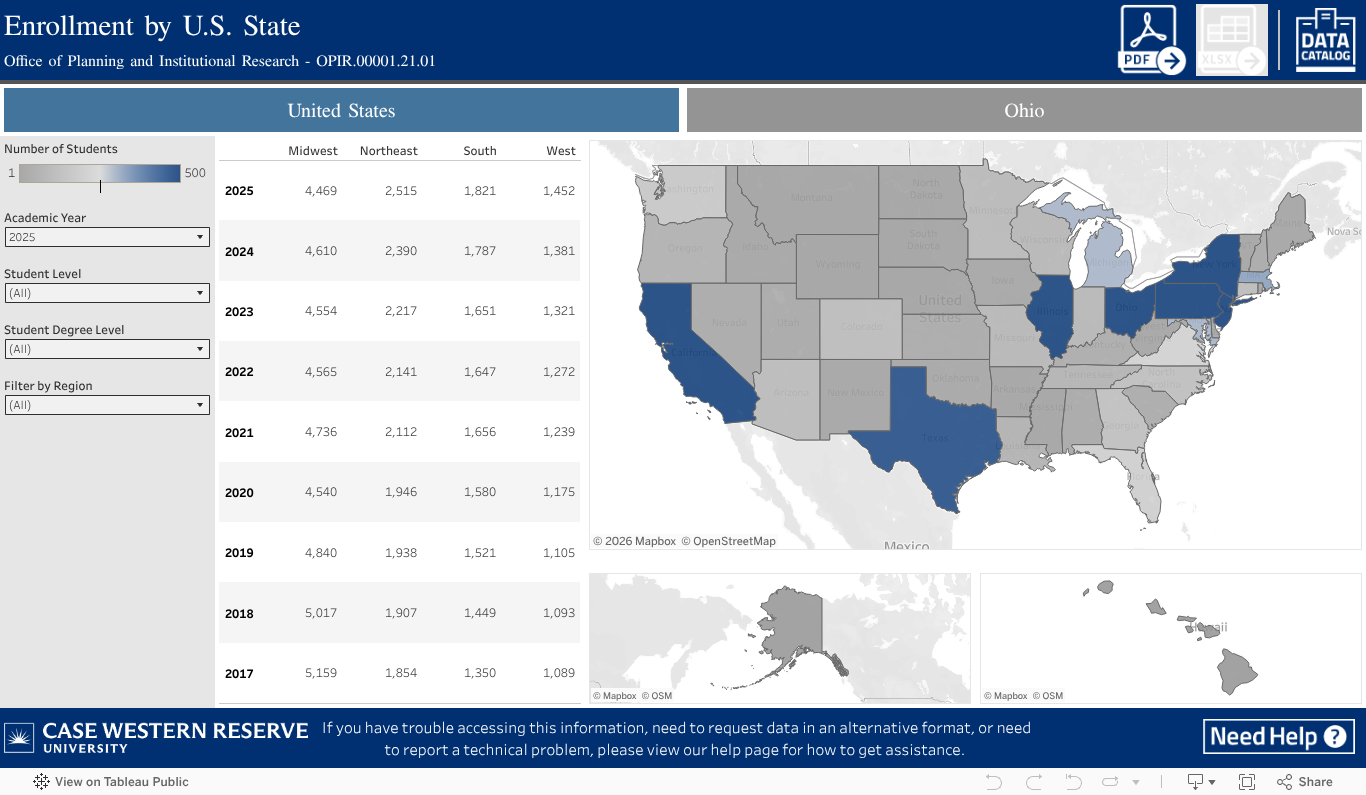
The student counts detailed in the maps represent student enrollment. Counts are as of October 15 of each academic year and represent student enrollment trends from Fall 2009 through Fall 2019.
This dashboard is designed to provide a rich and interactive visual experience; if this format does not meet your needs, please contact our office at cwrufacts@case.edu so we may assist you.
This dashboard is best viewed in full-screen mode.