I am a doctoral student in the lab of Dr. Kaixiang Cao. The main focus of our lab is to investigate how epigenetic events such as histone modifications and nucleosome positioning can impact cell self-renewal and differentiation. Moreover, the lab is also interested in how the crosstalk between the different epigenetic pathways can regulate both transcription and chromatin architecture, which can eventually modulate cell and animal development.
My project is focused on unveiling the role of histone modifiers in gene regulation and cell fate transition. These proteins have both catalytic activity on histones and non-catalytic roles in more complex cellular mechanisms and pathways. It was shown previously that the deletion and/or catalytic inactivation (CI) of histone modifiers impairs differentiation and development. For instance, by removing one histone modifier, the histone demethylase LSD1, the ability of embryonic stem cells (ESCs) to differentiate into an embryoid body (EB) changes dramatically, whereas the morphology of the ESC does not change (Figure 1). Interestingly, many histone modifiers are mis-regulated/mutated in different types of cancer including breast cancer and pancreatic cancer, rendering them potential therapeutic targets. Using CRISPR-Cas9 mediated gene editing, I aim to knock out and catalytically inactivate several epigenetic regulators in ESCs to determine their roles in gene regulation. I will use functional genomic approaches such as RNA-seq, ChIP-seq, ATAC-seq, and HiChIP. Moreover, I aim to perform differentiation experiments such as EB generation to identify the role of epigenetic modifiers in cell fate transition.
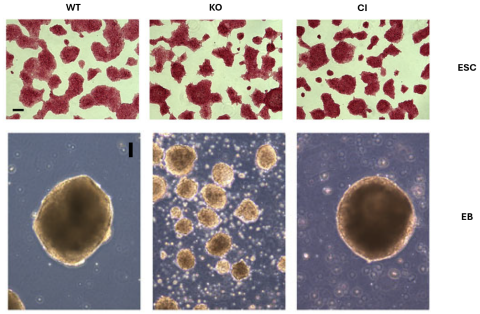
Figure 1 – The top panels represent alkaline phosphatase staining of WT, LSD1 KO, and LSD1 CI cells. Scale bar: 100 μm. The bottom panels represent phase-contrast images of day 6 EBs generated from WT, LSD1 KO, and LSD1 CI ESCs. Scale bar: 100 μm.