Welcome to the GIS Health & Hazards Lab
Mapping at the Scale of Intervention
We are spatial scientists with a passion for using geospatial technologies to improve the health of people in our community and in communities around the world. Specifically, we map “at the scale of intervention”. To do this we are leaders in new tool development, including freely available software. Our goal is to maximize the utility of the spatial data we collect and build capacity for communities to collect spatial data on conditions in their own environment. We are experts at solving problems that involve social and environmental spatial data.
But it is not enough to just map out key locations – these must be contextualized – meaning we need to know why a park is important, why a house has so many overdoses, or why one water point causes so much sickness. Using this approach we can help address the local opioid overdose situation, or identify where post-disaster lags, or where local environments might lead to increased disease outbreaks.
And if we don’t have the right tools for a problem presented to us, we will design them.
Research Statement
Our research is at the intersection of hazards and health working at what we call the scale of intervention. This includes micro environments such as the home, street, and neighborhood, and overseas micro environments within informal settlements or around key features such as water points. This scale is vital as problems are not just identified, but can also be tackled through policy and action with expert collaborators. Our research also follows three interrelated themes: spatial epidemiology, geographic context, and spatial confidentiality.
Methodologically, our work usually involves a combination of field geospatial data collection followed by spatial analysis. The methods we work with and develop are constantly changing because of the challenges encountered in the field. Another of our strengths is to develop new software to fully leverage the novel data we collect.
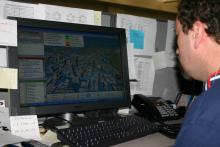
For example, we have developed a suite of software for the spatial video and spatial video geonarratives we collect. Simply put these geographically encoded videos, which provide a data source to make new maps in even the most challenging environment, can be easily viewed, the coordinates can be corrected, and basic mapping facilitated. Additional software allows for these videos to be combined using online visualization tools meaning that projects can be shared with collaborators at distance. Other tools compress the video, or overlay multiple spatial video paths so that a crawler can identify all those that pass through a common location.
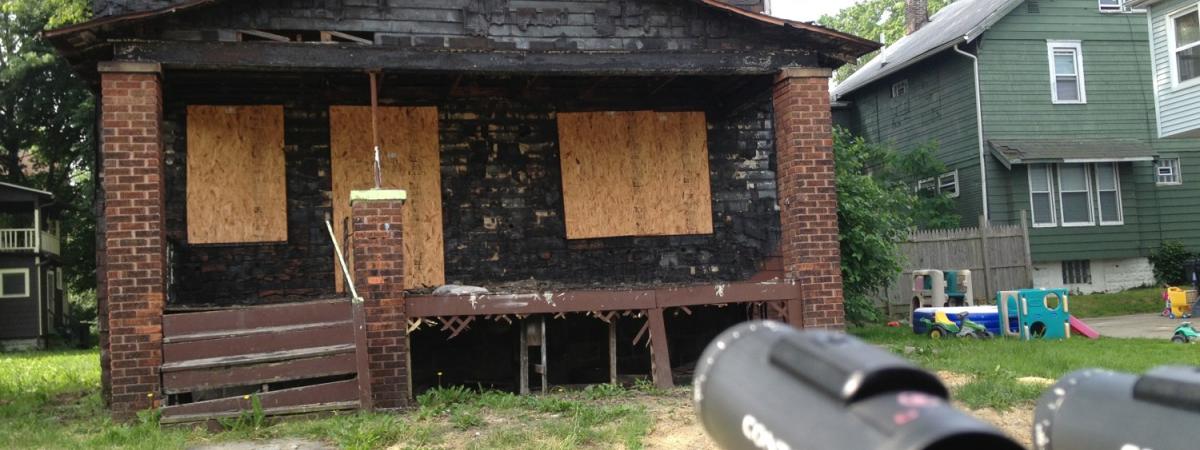
Using these software, we have supported various projects across the United States, including disaster damage assessment, disaster recovery, blight mapping, even pedestrian injury prediction. While overseas, in locations as diverse as Colombia, Ghana, Haiti and Kenya, we have mapped many different “impossible” landscapes, especially informal settlements and the local WaSH features, or localized risks for mosquito vectored disease
This software is freely available from us, some will be readily available for download from this website, just get in touch for help. We are always interested in new collaborations.
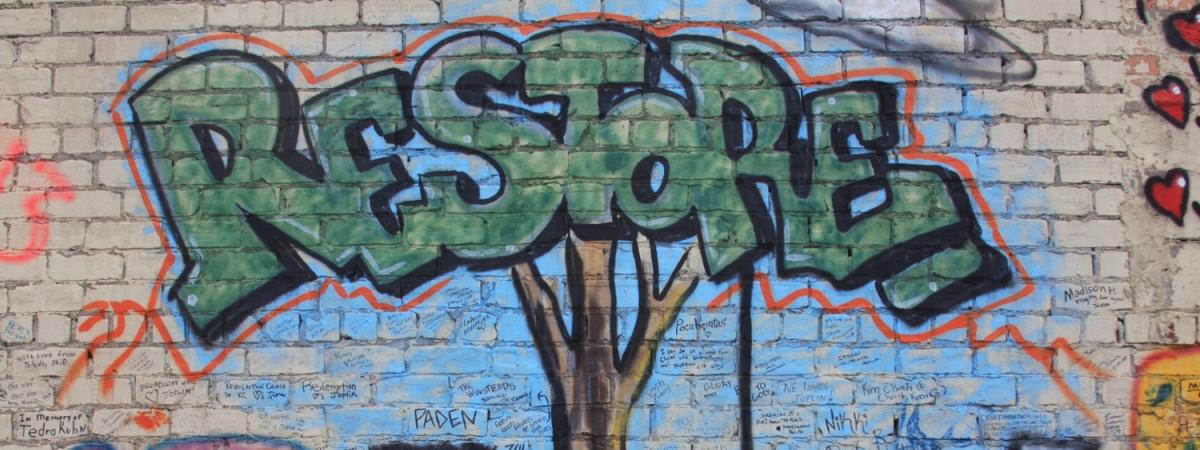
Our spatial video geonarrative work has gained attention across the United States, where it has been used to consider topics as diverse as asthma, community regeneration, health care access, homelessness, opioid overdoses, post disaster recovery and violence just to name a few examples. By adding an “expert” commentary to the spatial video, we let the environment stimulate the senses, the sights, sounds and smells, helping us provide context to what is happening, or what has happened. From this rich “deep” map we can see how social, spatial and historical factors coincide. We have also used these methods overseas to look at mosquito vectored disease in Colombia, Ghana and Kenya, and the historical setting around the Cambodian genocide. While a spatial video geonarrative provides a richer more spatially contextualized data set than previously possible, it is our software, especially Wordmapper that allows these narratives to be mined for content, both in a topical or spatial way.
Again, this software is freely available from us, and we would love to hear from potential collaborators.
We have also developed other software to better support spatial field work, combine and mine different space-text data layers, and something we are really proud of, a new software that allows for PSI data to be shared while preserving its spatial interconnections.
If you have any interest in exploring any of these topics further, please don’t hesitate to get in touch.
Akron Beacon-Journal (Akron, OH) Akron Launches Youth Violence Study by Doug Livingston, March 13, 2017.
Available online: https://www.ohio.com/akron/writers/akron-launches-youth-violence-study
The Suburbanite (online) STEM Students Look to Improve Water Quality, Garner Support for Education by Carolynn Mostyn, March 14, 2016. Available online: https://www.thesuburbanite.com/news/20160314/stem-students-look-to-improve-water-quality-garner-support-for-education
CityLab (online magazine) The accidental revelations of Sanborn maps by Tanvi Misra, October 13, 2014. Available online: http://www.citylab.com/housing/2014/10/the-accidental-revelations-of-sanborn-maps/381262/
The Plain Dealer (Cleveland, OH) Kent State geographers use computer mapping and video tools to help disaster recovery efforts by John Mangels, January 28, 2013. Available online: http://www.cleveland.com/science/index.ssf/2013/01/kent_state_geographers_use_com.html
Keeping a Promise - USC College magazine. November 1, 2010. Available online: https://dornsife.usc.edu/news/stories/826/keeping-a-promise
New York Times, “The changing landscape of the Lower Ninth Ward” Interactive spatial video application of my Hurricane Katrina recovery work.https://archive.nytimes.com/www.nytimes.com/interactive/2010/08/27/us/lower9th-5year-anniversary.html?ref=us Accompanies the article “On anniversary of Katrina, signs of healing.” By Campbell Robertson. 8/27/2010 and then the online version of the magazine story “Jungleland” 3/21/2012
The Atlantic, “The Post-Storm Chaser” April 12, 2018 by Nate Berg. Available online: https://www.citylab.com/environment/2012/04/post-storm-chaser/1792/
Forbes, “Video Tech Tracking Haiti’s Cholera Epidemic” July 11, 2012 by Lori Kozlowski. Available online: https://www.forbes.com/sites/lorikozlowski/2012/07/11/video-tech-tracking-haitis-cholera-epidemic/#4b17b09f3825
Fox8 “Cleveland Kent group returns from mapping Okla. Damage” 6/2/2013 Available online: https://fox8.com/2013/06/03/kent-group-returns-from-mapping-okla-damage/
The Plain Dealer “Crime hotspots to be identified by Kent State researchers” 3/17/2014
https://www.cleveland.com/metro/2014/03/crime_in_urban_neighborhoods_t.html
Houston Chronicle “Images show Hurricane Katrina recovery over the course of 10 years” 8/19/2015. by Carol Christian, Available online:
https://m.chron.com/news/nation-world/nation/article/Images-show-Hurricane-Katrina-recovery-over-the-co-6453198.php#photo-8489661
News Cleveland 19 “Researchers look for lead paint 'hot spots'”
https://www.cleveland19.com/story/29984820/researchers-look-for-lead-paint-hot-spots/
Health Impact Assessment of the Proposed Englewood Line Trail. Chicago Department of Health & Illinois Public Health Institute, Chicago, Illinois.
https://iphionline.org/center-for-policy-and-partnerships/englewood_line_trail_hia/
Eastside Greenway Health Impact Assessment: Promoting Health and Equity in All Policies. Cuyahoga County Board of Health, Cleveland, Ohio.
https://www.pewtrusts.org/-/media/assets/external-sites/health-impact-project/ccbh-2015-cle-esg-rename.pdf
Columbus Safe Routes to School District-Wide Travel Plan Health Impact Assessment. Columbus Public Health,
Columbus, Ohio.
https://www.columbus.gov/uploadedFiles/Columbus/Departments/Public_Health/New_Programs/Healthy_Places/SafeRoutes_HIA_FullReport.pdf
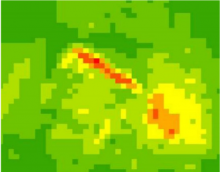
QR245 Spatial Patterns of Mortality Risk Within a Tornado Path: A Fine-Scale Spatial Analysis of Spatial Video-Collected Damage Data for the Newcastle-Moore Tornado of May 21, 2013 (2013). Andrew Curtis, Spencer Baker, Xinyue Ye, Jacqueline Curtis, and Grant Floyd
https://hazards.colorado.edu/uploads/quick_report/curtis_2013.pdf
QR236 Spatial Patterns of Post-Wildfire Neighborhood Recovery: A Case Study From the Waldo Canyon Fire (Colorado Spring, Colorado, 2012) (2013). Jacqueline Curtis, Andrew Curtis, Andrea Szell, Adam Cinderich
https://hazards.colorado.edu/uploads/quick_report/mills_2013.pdf
QR180 Hurricane Katrina: GIS Response for a Major Metropolitan Area (2006) Andrew Curtis, Jacqueline W. Mills, Jason K. Blackburn, and John C. Pine
https://hazards.colorado.edu/uploads/basicpage/qr180.pdf
Ajayakumar, J., A. Curtis, and J.W. Curtis (2019) Addressing the Data Guardian and Geospatial
Scientist Collaborator Dilemma: How to share health records for spatial analysis while maintaining patient
confidentiality. International Journal of Health Geographics
https://ij-healthgeographics.biomedcentral.com/articles/10.1186/s12942-019-0194-8
Ajayakumar, J., A. Curtis, S. Smith, and J.W. Curtis (2019) The Use of Geonarratives to Add Context to Fine Scale Geospatial Research. International Journal of Environmental Research and Public Health 16(3):515 https://doi.org/10.3390/ijerph16030515
https://www.ncbi.nlm.nih.gov/pmc/articles/PMC6388256/
Shook, E., A. Curtis, J.W. Curtis, G. Gibson, A. Vander horst, V. Little, C. Woolverton (2019) Assessing the
Geographic Context of Risk Perception and Behavioral Response to Potential Ebola Exposure. International Journal
of Environmental Research and Public Health 16(5):831 https://doi.org/10.3390/ijerph16050831
https://www.ncbi.nlm.nih.gov/pmc/articles/PMC6427407/
Curtis, J.W. (2017) Spatial Distribution of Child Pedestrian Injuries along Census Tract Boundaries:
Implications for Identifying Area-based Correlates. PLoS ONE 12(6): e0179331.
https://journals.plos.org/plosone/article?id=10.1371/journal.pone.0179331
Curtis, A., J.W. Curtis, E. Shook, S. Smith, E. Jefferis, L. Porter, L. Schuch, C. Felix, and P. Kerndt.
(2015) Spatial Video Geonarratives and Health: Case Studies in Post-disaster Recovery, Crime, Mosquito control
and TB in the Homeless. International Journal of Health Geographics 14(22).
https://ij-healthgeographics.biomedcentral.com/articles/10.1186/s12942-015-0014-8
Curtis, J.W., A. Curtis, J. Mapes, A. Szell, and A. Cinderich. (2013) Using Google Street View for
Systematic Observation of the Built Environment: Analysis of Spatio-temporal Instability of Imagery Dates.
International Journal of Health Geographics 12(53).
https://ij-healthgeographics.biomedcentral.com/articles/10.1186/1476-072X-12-53
Curtis, A., J.W. Mills, and M. Leitner. (2006) Spatial Confidentiality and GIS: Re-engineering Mortality
Locations from Published Maps about Hurricane Katrina. International Journal of Health Geographics 5(44)
https://ij-healthgeographics.biomedcentral.com/articles/10.1186/1476-072X-5-44
Our Story:
The germ of our work was in the World Health Organization Collaborating Center for Remote Sensing and Public Health at Louisiana State University. Our projects there, both domestic and international, were always focused on what we called the scale of intervention. Our mission was to make a difference, to collect the right kind of data, no matter how challenging the topic or environment. Then, Hurricane Katrina hit and we become part of the geospatial response to that catastrophe. From that beginning we began to develop new field technologies, techniques and software as the need arose. Now, fifteen years later we are in the Case Western Reserve University School of Medicine, and we are ready to reach out beyond our current projects to start the next generation of collaborations.
To do this, we have developed two main field approaches. The first, a spatial video, allows anyone to record video of any landscape. Because the video has coordinates in it, these images become the source for mapping. To really make this approach work we have developed software that allows us to simultaneously view and map spatial video collected using a variety of different cameras. We can even make “new” spatial video by using a non-spatial camera (even your phone) by then adding in coordinates. Using spatial video, we have addressed different disaster damage assessments and how a community recovers afterwards. We have mapped out blight and its association with local violence.
In countries as diverse as Bangladesh, Cambodia, Ghana, Haiti, Kenya, Nicaragua we have mapped out clean water access and potential mosquito habitats. Spatial video means that any environment can be mapped. It puts you in charge of when and how frequently that data can be collected. In this way we can see how things change over time. Currently we are working on Machine Learning approaches to automate some of this mapping. On our community page and our research page we explore these ideas further because we want to hear from you and talk about where and what we can work on together.
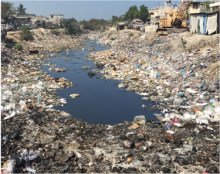
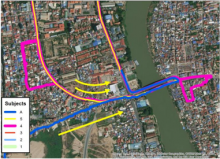
The second method we developed, a spatial video geonarrative, drives hard at adding depth, and adding context to our maps. When we collect our spatial video (by car, by bike, by boat or even walking) if an expert, or a community member, narrates the landscape we move through, then that final map will not only show key locations, but the importance of that place – what happens there and why, and whether it has changed or not. In this way we have heard about why overdoses continue to occur in the same rental building, what it was like to live in fear of local gangs, what is it like to be a mother of multiple children suffering from Asthma, the daily challenges of being homeless, and the hopes and desires of a community as it begins to reinvent itself. Overseas we have used this method to link violence and health, to show how trash can cause disease outbreaks, and what it is like to witness genocide.
To maximize such powerful narratives, we have developed new software that allows us to map, explore, and mine what is said. By adding multiple narratives together, we build a map deep in meaning. And because we have the video, we can also see what is being described. This combination of image, description and map is powerful. We originated this method, and we continue to explore how it can be improved.
While these two methods are what we are best known for, we also have an extensive record of developing other techniques, such as a new spatial confidentiality software called Privy that allows collaborators to safely work on HIPAA data. And we are also experts in more traditional Geographic Information System (GIS) mapping and analysis.
Simply put there is a research collaboration page and a community collaboration page. On these we will provide a few snapshot examples of past work and links to papers. There will be a software page where you will be able to download our video mapping tool, our wordmapper tool, and our Privy tool. Other packages are also available by request, but these three are our most popular developments.
And finally, there is a funding page. Most of our work, and most of our collaborations, are in resource challenged areas. While we will always search for research funding, it is the generosity of benefactors that really gives us the flexibility to grow, to bring in community partners, and to fund students.
Thank you for visiting our webpage and please feel free to contact us if you have any questions!
Would You Like to Donate?
If you have read through our website and believe in the work we do, maybe you could help out? While we always try and find funds for specific projects – such as reducing opioid overdoses – it is hard to support all projects in this way.
Ideally, we would like to have funds to be able to support communities when they come to us wanting to use our methods.
We would like to support other researchers with their ideas in a fledgling form – providing either data collection or even developing new software.
We would like to support health mapping in overseas environments where the disease risk is greatest and the resources and data available are minimal.
We would like to support students to work on our projects. There is no reason why high school students can’t learn about research methodologies through these projects.
But to achieve these goals we do need funding help.
If you would like to donate to any of these specific areas – or more generally to support the work of the GIS Health & Hazards Lab then please get in touch. We would love to hear from you.
Community Statement
Does your community need a map made?
Do you think there is a problem that needs to be investigated?
Would you like to record the different perspectives on a plan or idea for your community?
Hopefully we can help.
Our research focuses on local environments -- for example around the home or in the community. However, we have always been mindful of why we do this type of work -- to try and identify how to reduce health disparities and generally improve the quality of life. A good illustration of this is with our recent work on Asthma. It was shocking for us to see how so many children in the same family suffer from the disease. By using our spatial video geonarrative method, which is a walk along, or drive along interview, we were able to map out the locations where those asthma attacks happen. We were also able show where these families go so that their children can enjoy themselves without having an attack. By listening to these families we better understood the problem, and also found potential solutions that could be shared with others.
This is because some of the most important insights and solutions come from those living in the community – and yet unfortunately their voice is often not heard.
That’s where we come in. We have developed a method to help capture that voice.
We have worked with many different communities on topics ranging from community gardens to coastal land loss. These are not research topics – but rather a community inspired look at a situation important to them.
If you, as a leader, a community member, or just a concerned resident, would like us to talk to you about your idea, make our equipment and methods freely available, and find the right student to partner with you to turn your idea into a map, and then a solution –please get in touch with us. We will help to the best of our ability.